
Trellis Equity iconTRELLIS EQUITY
The Numbers Behind the Platform

Execution Track Record

Eighty-two investments completed by the principals since 2015. Forty-two deals taken full-cycle from acquisition to exit at a 67.2% equity-weighted IRR and a 1.72x weighted equity multiple, with every realized investment returning capital above cost.

67.2%
Equity-Weighted Realized IRR · 42 Exits
1.72x
Weighted Equity Multiple on Realized Deals
$510M+
Current Portfolio Value · 41 Assets
$1.5B+
Debt & Equity Placed by the Principals
Current Portfolio
Assets Held41
Total Cost Basis$382M
Current Value (Internal Estimate)$510M+
States10
Realized Track Record
Deals Taken Full-Cycle Since 201542
Equity Invested Across Realized Deals$27.8M
Investments Completed by the Principals83
Realized Investments Below Cost0

Track-record information reflects investments made by principals of Trellis Equity and affiliated entities and is unaudited. Current values are internal estimates as of September 2026. Past performance is not indicative of future results.
Portfolio Highlights
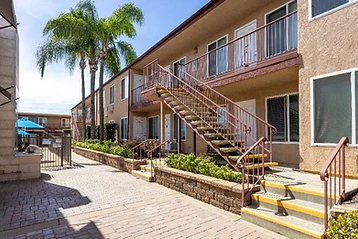
Courtyard walkway and units at Tierra del Rey apartments in La Mesa
La Mesa, CA · Under Contract

6985 Waite Drive

Asset Class81-Unit Multifamily · Tierra del Rey
StrategyValue-Add in a Prime Location
Execution7.3% Unlevered Return on Cost at Stabilization
$15.6M Purchase · $16.5M Value at Stabilization
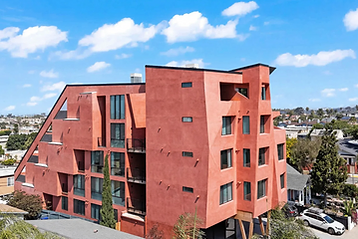
Aerial view of the terracotta-colored Nok Nok apartment building at 4384 Hamilton Street, San Diego
San Diego, CA

4384 Hamilton Street

Asset Class29-Unit Multifamily · Nok Nok
StrategyNew Construction Below Replacement Cost
Execution6.25% Unlevered Return on Cost at Stabilization
$8.5M Purchase · $10.0M Value at Stabilization
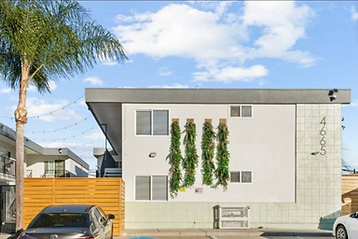
White modern multifamily building with vertical planters at 4665 34th Street, San Diego
San Diego, CA

4665-69 34th Street

Asset ClassMultifamily
StrategyValue-Add · Acquired 2024
Execution$698K Capital Plan
$4.5M Purchase · $5.2M Total Project Cost

Representative assets shown. Principal track record, unaudited. Current values are internal estimates as of September 2026. The full schedule of 41 current holdings and 42 realized investments is available to qualified partners upon execution of a confidentiality agreement.

Performance · Assets Acquired 2021 to 2023

Thirty Assets Bought at the Top of the Market Have Gone Full Cycle. Every One of Them Made Money.

What We Paid

$42.2M Total Cost Basis

Thirty assets acquired in 2021 to 2023 at an aggregate purchase price of $32.2M, with a $42.2M total cost basis including capital improvements. These were bought at peak pricing, when rates were near zero and most operators were stretching assumptions to keep acquiring. We underwrote cautiously and always paid below retail price in a risky time in the market. We are never the highest paying buyers in any market, and that has paid off for our investors thus far.

What We Returned

$57.0M Gross Proceeds · 2.15x

A 2.15x equity-weighted multiple on $10.4M invested, and zero investments that lost investor capital. Every one of those thirty exits was realized above cost, with a worst outcome of 1.22x.

Trellis Equity icon
TRELLIS EQUITY

A Southern California based owner-operator of new construction below replacement cost and value-add multifamily across California, with an institutional platform behind every asset we buy.

Inquiries

This website is for informational purposes only and does not constitute an offer to sell or a solicitation of an offer to buy any securities. Any such offer or solicitation will be made only through definitive offering documents, which will contain material information regarding investment objectives, risks, fees, and expenses. Past performance is not indicative of future results. Investments in real estate involve substantial risk, including loss of principal, and are suitable only for sophisticated investors who can bear such risks.

© 2026 Trellis Equity. All rights reserved.